Universal Insurance Holdings Reports Fourth Quarter 2018 Results
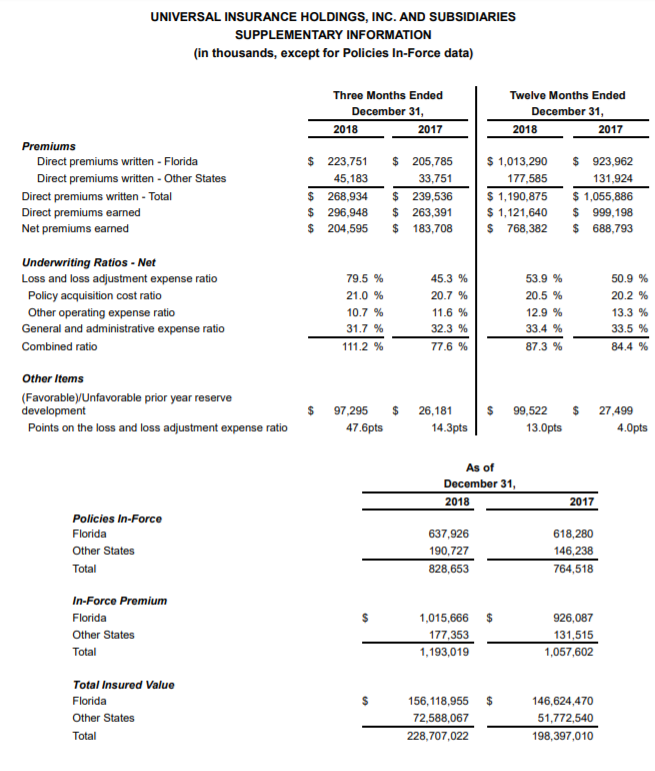
- 4Q18 direct premiums written (DPW) up 12.3% to $268.9 million; FY18 up 12.8% to $1.2 billion
- 4Q18 other states DPW up 33.9%; FY18 other states up 34.6%
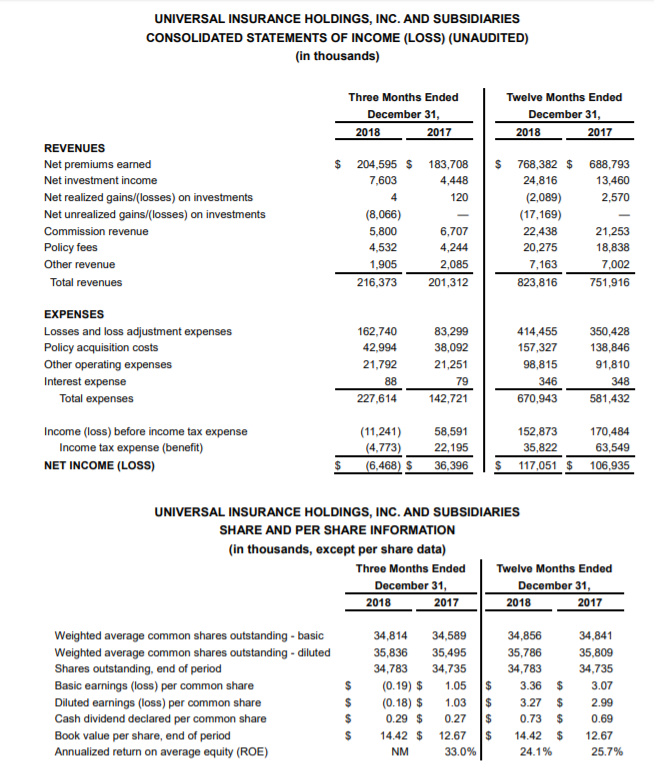
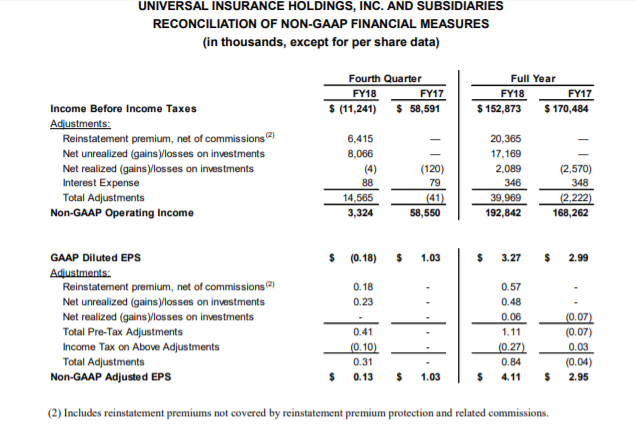
- 4Q18 diluted GAAP earnings per share (EPS) of $(0.18), non-GAAP adjusted EPS1 of $0.13
- Year-over-year book value per share up 13.8% to $14.42
- FY18 diluted GAAP EPS up 9.4% to $3.27, non-GAAP adjusted EPS1 up 39.3% to $4.11
- FY18 combined ratio of 87.3%
- FY18 return on average equity of 24.1%
(1) Excludes net realized and unrealized gains and losses on investments as well as extraordinary reinstatement premiums and associated commissions (“non-GAAP adjusted EPS”). Reconciliations of GAAP to non-GAAP financial measures are provided in the attached tables.
Fort Lauderdale, Fla., February 28, 2019
Universal Insurance Holdings (NYSE: UVE) (the “Company”) reported 2018 fourth quarter diluted EPS of $(0.18) on a GAAP basis and $0.13 non-GAAP adjusted EPS1. Quarterly direct premiums written were up 12.3% from the year-ago quarter to $268.9 million. Book value per share grew to $14.42, an increase of 13.8% with a return on average equity of 24.1% for the year.
Our fourth quarter diluted GAAP EPS of $(0.18) was primarily affected by a $97.3 million net allocation to strengthen prior accident years’ loss reserves. This strengthening resulted from an increase in the frequency and severity of noncatastrophe claims spanning several prior accident years, including reopened claims, newly reported claims, increased litigation and increased loss settlements of claims above carried values. This reflects the trends and dynamics in the Florida marketplace attributable to assignment of benefits (AOB) and the increased solicitation of prior years’ claims in the post Hurricane Irma environment. On a non-GAAP adjusted basis, excluding net realized and unrealized gains and losses on investments, which are not core to our business, as well as extraordinary reinstatement premiums and associated commissions, we reported a quarterly adjusted EPS of $0.13.
“We reported strong top line growth, book value growth and return on equity for the year, marking our sixth consecutive year with greater than 20% return on equity, despite three consecutive years of active catastrophic events and the systemic claims representation in Florida that resulted in an increase in prior year development. Our results are supported by our comprehensive reinsurance program and our vertically integrated service businesses. To that end, over the past year, particularly in the fourth quarter, we have accelerated our operational focus on claims resolutions, with expectations to help create earnings stability for the future.” said Sean P. Downes, Chairman and Chief Executive Officer.
“Looking forward, we continue to focus on the customer experience and have launched a customer-facing digital transformation. We believe these changes provide key value-added services to our consumers, better positioning us for the future. As part of this effort, we are launching ‘Clovered,’ our new digital insurance distribution channel. Clovered will go live on March 1st and enables consumers to ‘Prepare, Protect, and Recover’ from the unexpected with educational resources that we plan to eventually supplement with the ability to purchase a policy online as we currently do with our proof of concept, Universal Direct. In addition, we have revitalized our parent company brand and launched an all-new investor website as well as rebranded certain subsidiaries to provide distinction for our primary insurance lines subsidiaries and suite of integrated service capabilities. Lastly, we have refreshed our ‘Universal Property’ brand and created a new online presence for Universal Property and American Platinum that enables consumers to download policy documents, track a claim for certain loss types, and purchase a policy. We are excited about taking steps to strengthen our foundation for the future and what it means for our consumers, our combined business, and our stakeholders.”
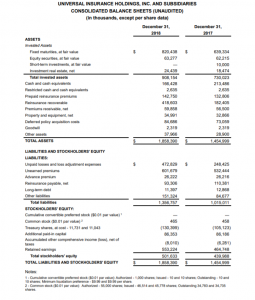
Summary Financial Results
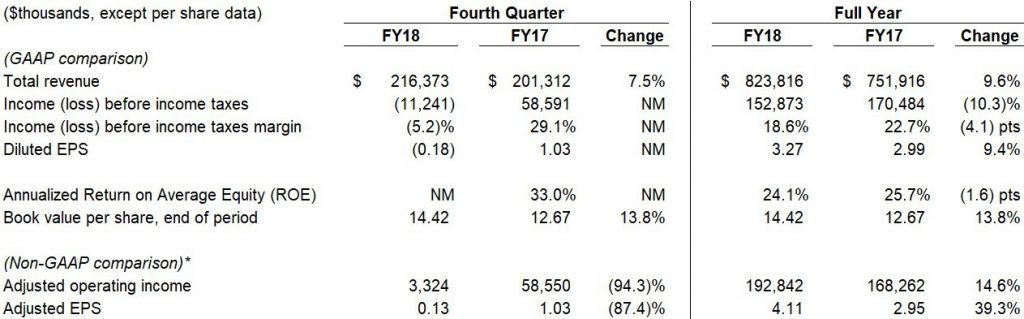
Total revenue grew high single digits for both the quarter and the year, driven primarily by higher organic premium volume and pricing. GAAP diluted EPS grew 9.4% for the year and non-GAAP adjusted EPS had growth of 39.3% for the year, in each case driven by higher premium volume, pricing, integrated services and a lower effective tax rate, partially offset by unfavorable reserve development. Income before income tax was down 10.3% for the year and adjusted operating income was up 14.6% for the year. Income before income tax produced an 18.6% margin for the year, bolstered by our integrated services businesses. The Company produced solid annualized return on average equity of 24.1% and book value per share growth of 13.8% for the year, despite several catastrophic events and systemic claims representation in Florida.
Underwriting
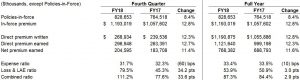
Direct premiums written were up double digits for the quarter, led by growth of 8.7% in Florida and 33.9% in Other States. For the year, direct premiums written were also up double digits led by 9.7% in Florida and 34.6% in Other States. Underlying growth in Florida was strengthened by policy mix and the average statewide rate increase of 3.4% approved in late 2017, while our Other States geographic expansion continues to be strong.
On the expense side, the combined ratio increased 33.6 points for the quarter and 2.9 points for the year driven by an increase in prior year development, partially offset by our adjusting business and an improvement in the expense ratio as set forth below:
- The expense ratio improved 60 basis points for the quarter driven by a 90 basis points improvement in the other operating expense ratio, partially offset by a 30 basis point increase in the policy acquisition cost ratio. For the year, the expense ratio improved 10 basis points driven by a 40 basis points improvement in the other operating expense ratio, partially offset by a 30 basis points increase in the policy acquisition cost ratio.
- The net loss and loss adjustment expense ratio increased 34.2 points for the quarter and 3.0 points for the year. This reflects an increase in prior year development and catastrophe related losses partially offset by inversely correlated earnings generated by our adjusting business. Quarterly and full year drivers for 2018 include:
- Prior year reserve development of $97.3 million or 47.6 points for the quarter and $99.5 million or 13.0 points for the year.
- Weather events in excess of plan of $9.8 million or 4.8 points for the quarter were directly related to
Hurricane Michael. For the full year, weather events in excess of plan were $15 million or 1.9 points. - All other losses and loss adjustment expense of $55.7 million or 27.2 points for the quarter and $300 million or 39.1 points for the year includes the benefit of inversely correlated earnings generated by our claims adjusting business.
Services
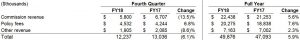
Total services revenue declined for the quarter as a result of the prior year’s quarter commission revenue including an incremental $1.3 million reinstatement premium commission paid to our reinsurance intermediary Blue Atlantic, partially offset by policy fees due to continued growth in premium volume. For the full year, total services revenue increased 5.9% as a result of growth in all three service categories led by policy fees from premium volume.
Investments
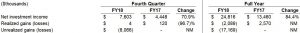
Net investment income increased 70.9% for the quarter and 84.4% for the year due to higher long-term and shortterm interest rates, asset mix, as well as higher average levels of invested assets. Realized losses in 2018 were the result of liquidating municipal bonds in light of diminished tax benefits. Unrealized losses were driven by market volatility in equity securities.
Capital Deployment
During the fourth quarter, the Company repurchased approximately 346 thousand shares at an aggregate cost of $14.2 million. For the full year the Company repurchased approximately 689 thousand shares at an aggregate cost of $25.3 million. The Company’s current share repurchase authorization program has $14.5 million remaining as of December 31, 2018 and runs through May 31, 2020.
On January 31, 2019 the Board of Directors of the Company declared a quarterly cash dividend of 16 cents per share of common stock, payable March 25, 2019, to shareholders of record as of the close of business on March 11, 2019.
Conference Call and Webcast
- Friday, March 1, 2019 at 8:30 a.m. ET
- U.S Dial-in Number: (855) 752-6647
- International: (503) 343-6667
- Participant code: 6872069
- Listen to live webcast and view presentation: UniversalInsuranceHoldings.com
- Replay of the call will be available on the UVE website and by phone at (855) 859-2056, or internationally at (404) 537-3406,
using the participant code: 6872069 through March 15, 2019
About Universal Insurance Holdings, Inc.
Universal Insurance Holdings (UVE) is a holding company offering property and casualty insurance and value-added insurance services. We develop, market, and write insurance products for consumers predominantly in the personal residential homeowners lines of business and perform substantially all other insurance-related services for our primary insurance entities, including risk management, claims management and distribution. We sell insurance products through both our appointed independent agents and through our direct online distribution channels in the United States across 17 states (primarily Florida). Learn more at UniversalInsuranceHoldings.com.
Non-GAAP Financial Measures
This press release contains non-GAAP financial measures within the meaning of Regulation G promulgated by the Securities and Exchange Commission (“SEC”), including adjusted earnings per diluted share for the fourth quarter of 2018 and 2017 and the full year 2018 and 2017, in each case excluding the impact of the net realized and unrealized gains and losses on investments as well as extraordinary reinstatement premiums and associated commissions. Extraordinary reinstatement premiums are not covered by reinstatement premium protection and attach just below the Florida Hurricane Catastrophe Fund (FHCF) reinsurance layer, which has not been entered into in more than 10 years. Adjusted operating income for the fourth quarter of 2018 and 2017 and the full year 2018 and 2017, in each case, exclude the impact of the net realized and unrealized gains and losses on investments as well as interest expense and extraordinary reinstatement premiums and associated commissions. A “non-GAAP financial measure” is generally defined as a numerical measure of a company’s historical or future performance that excludes or includes amounts, or is subject to adjustments, so as to be different from the most directly comparable measure calculated and presented in accordance with generally accepted accounting principles (“GAAP”). UVE management believes that these non-GAAP financial measures, when considered together with the GAAP financial measures, provide information that is useful to investors in understanding period-over-period operating results, separate and apart from items that may, or could, have a disproportionately positive or negative impact on results in any particular period. UVE management also believes that these non-GAAP financial measures enhance the ability of investors to analyze UVE’s business trends and to understand UVE’s performance. UVE’s management utilizes these non-GAAP financial measures as guides in long-term planning. Non-GAAP financial measures should be considered in addition to, and not as a substitute for or superior to, financial measures presented in accordance with GAAP.
Forward-Looking Statements
This press release may contain “forward-looking statements” within the meaning of the Private Securities Litigation Reform Act of 1995. The words “believe,” “expect,” “anticipate,” “will, ” “plan, ” and similar expressions identify forwardlooking statements, which speak only as of the date the statement was made. Such statements may include commentary on plans, products and lines of business, marketing arrangements, reinsurance programs and other business developments and assumptions relating to the foregoing. Forward-looking statements are inherently subject to risks and uncertainties, some of which cannot be predicted or quantified. Future results could differ materially from those described, and the Company disclaims any intention or obligation to update or revise any forward-looking statements, whether as a result of new information, future events, or otherwise. For further information regarding risk factors that could affect the Company’s operations and future results, refer to the Company’s reports filed with the Securities and Exchange Commission, including the Company’s Annual Report on Form 10-K to be filed for the fiscal year ended December 31, 2018.
Investor Relations Contact:
Rob Luther, 954-595-7272
VP, Corporate Development, Strategy & IR
rluther@universalproperty.com
Media Relations Contact:
Andy Brimmer / Mahmoud Siddig, 212-355-4449
Joele Frank, Wilkinson Brimmer Katcher