Universal Insurance Holdings Reports Second Quarter 2020 Results
- 2Q20 direct premiums written (“DPW”) up 13.1% to $404.7 million; 1H20 up 14.2% to $739.2 million
- 2Q20 other states (non-Florida) DPW up 14.5%; 1H20 up 16.5%
- 2Q20 diluted GAAP earnings per share (“EPS”) of $0.62, non-GAAP adjusted EPS1 of $0.52
- Book value per share increased 8.5% to $16.56 when compared to last quarter
- 1H20 combined ratio of 96.8%
- 1H20 annualized return on average equity of 15.5%
- 1H20 returned $27.0 million to shareholders through share repurchases and dividends
- Adjusted 2020 outlook to reflect the previously announced historically above average second quarter weather events
1 Excludes net realized and unrealized gains and losses on investments as well as extraordinary reinstatement premiums and associated commissions (“non-GAAP adjusted EPS”). Reconciliations of GAAP to non-GAAP financial measures are provided in the attached tables.
Fort Lauderdale, Fla., July 29, 2020 – Universal Insurance Holdings (NYSE: UVE) (the “Company”) reported 2020 second quarter diluted EPS of $0.62 on a GAAP basis and $0.52 non-GAAP adjusted EPS1. Quarterly direct premiums written were up 13.1% from the year-ago quarter to $404.7 million. 2Q20 annualized return on average equity was 15.6%.
“We delivered solid second quarter results, underpinned by strong top line growth as a result of pockets of attractive pricing and volume, resulting in an annualized return on average equity in the first half of 2020 of 15.5%,” said Stephen J. Donaghy, Chief Executive Officer.
“In addition, we continue to enter new states as an agent, serving independent third-party carriers with our digital insurance agency Clovered℠. We launched Clovered℠ just over a year ago and continue to add partners and expand its offerings to consumers, while enhancing the overall digital experience. Clovered℠ continues to be an attractive growth opportunity for us, with approximately 40% premium growth from the year-ago second quarter to its total book of business, while growing non risk bearing business by over 200% in the same time period. The shift to online policy acquisition continues to grow in part due to a very desirable refinance and new home market. Clovered℠ represents Universal Property and Casualty’s fastest growing agency across its nearly 10,000 independent agents. Though we are off to a solid start to the first half of the year overall, including the successful completion of our reinsurance renewal on time and on budget, we are taking a more measured approach to guidance as a result of previously announced historically above average weather events in the second quarter. We believe our liquidity and ability to drive growth remain strong and we continue to execute for our consumers and stakeholders.”
Through the second quarter of 2020, we have not seen a material impact from the COVID-19 pandemic on our business, our financial position, our liquidity, or our ability to service our policyholders and maintain critical operations, with the exception of a decrease in fair value of certain investment securities, which substantially recovered in the second quarter.
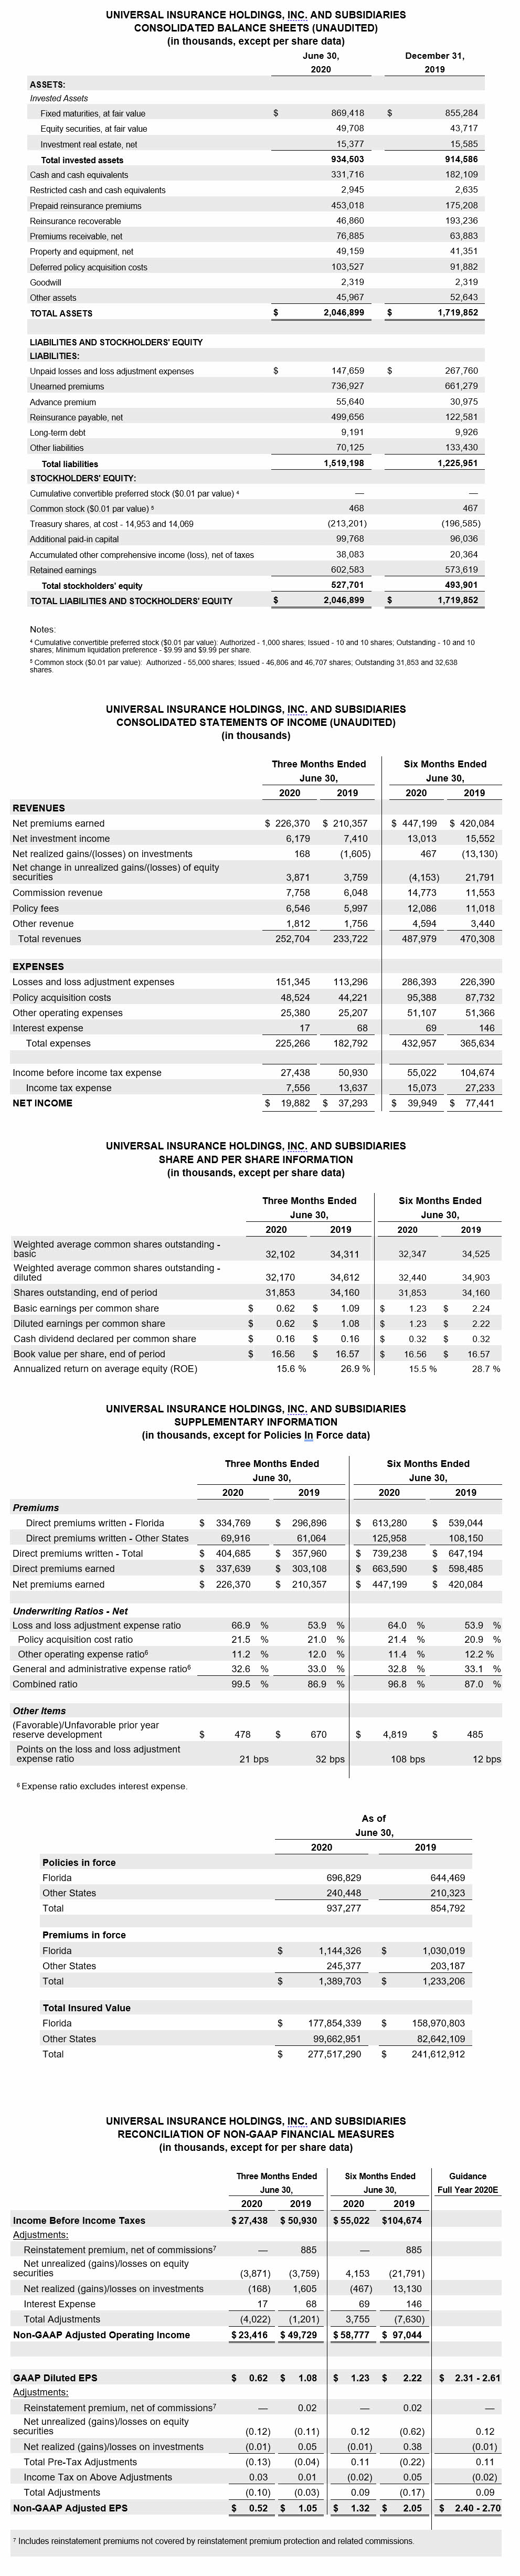
Summary Financial Results
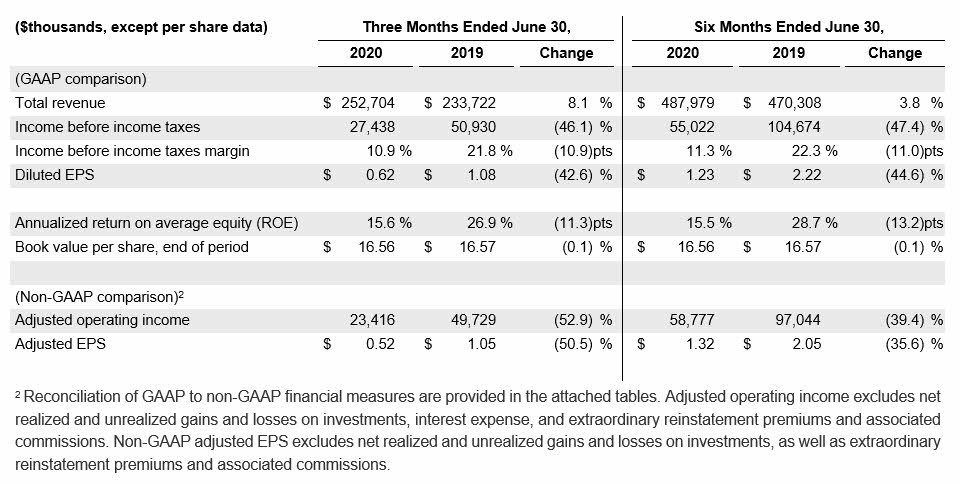
Total revenue increased 8.1% for the quarter and 3.8% for 1H20, driven primarily by higher organic premium pricing and volume and our integrated services, partially offset by higher reinsurance costs and decreased net investment income. Income before income tax produced a 10.9% margin for the quarter and 11.3% for 1H20, which was primarily impacted by historically above average second quarter weather events. GAAP diluted EPS and non-GAAP adjusted EPS results for the quarter and the first half 2020 were driven by the aforementioned factors, partially offset by a reduced share count. The Company produced a solid annualized 1H20 return on average equity of 15.5%.
Underwriting
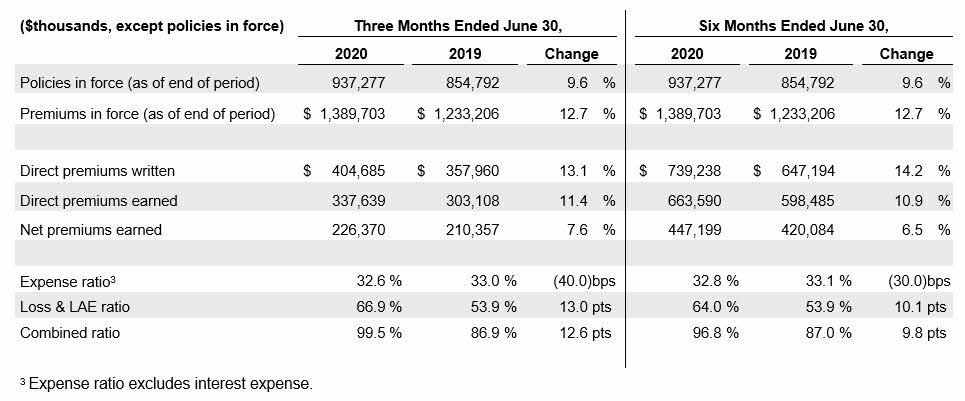
Direct premiums written were up double digits for the quarter, led by strong direct premium growth of 14.5% in Other States (non-Florida), and 12.8% in Florida. For 1H20, direct premiums written were also up double digits led by 16.5% in Other States (non-Florida), and 13.8% in Florida. In addition to increased volume, rate increases becoming effective in Florida and certain other states, along with slightly improved retention, contributed to the premium growth.
On the expense side, the combined ratio increased 12.6 points for the quarter and 9.8 points for 1H20. The increases were driven primarily by increased weather events, a higher core loss ratio and the impact of higher reinsurance costs on the ratio, partially offset by a reduction in the expense ratio as set forth below.
- The expense ratio improved by 40 basis points for the quarter, primarily related to an 80 basis point improvement in the other operating expense ratio due in large part to economies of scale. The policy acquisition cost ratio increased by 50 basis points for the quarter, primarily due to the impact of higher reinsurance costs. For 1H20, the expense ratio improved by 30 basis points. The improvement was driven by a 80 basis point decrease in the other operating expense ratio, which was partially offset by a 50 basis point increase in the policy acquisition cost ratio.
- The net loss and loss adjustment expense (“LAE”) ratio increased 13.0 points for the quarter and 10.1 points for 1H20. Quarterly and 1H20 drivers include:
-
- Weather events in excess of plan of $17.0 million or 7.5 points ($2.0 million in 2Q19) for the quarter were related to the previously announced historically above average second quarter weather events from 14 Property Claims Services (PCS) events across a series of states where the company does busines For 1H20, weather events in excess of plan were $18.0 million or 4.0 points ($7.0 million in 1H19).
-
- Prior year reserve development of $478 thousand or 20 basis points for the quarter and $4.8 million or 1.1 points for 1H20 were incurred but not reported related to prior year’s catastrophe events.
-
- All other losses and LAE of $133.9 million or 59.2 points for the quarter, and $263.6 million or 58.9 points for 1H20 were primarily related to diversified growth, and accruing incremental reserves for the current accident year.
Services
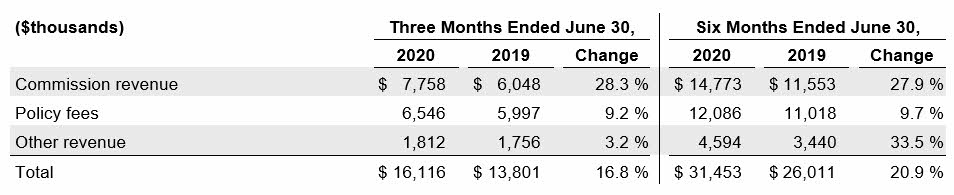
Total services revenue increased 16.8% for the quarter and 20.9% for 1H20 driven primarily by commission revenue earned on ceded premiums.
Investments
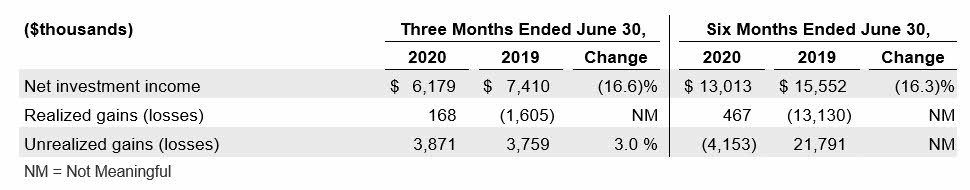
Net investment income decreased 16.6% for the quarter and 16.3% for the first half of 2020, primarily due to lower yields on cash and short term investments during the first half of 2020 when compared to the first half of 2019. The prior year also included one-time income benefits from a special dividend received and a one-time reduction in investment expenses. Cash and cash equivalents increased 82.2% to $331.7 million when compared to the end of 2019 as a result of taking defensive measures to preserve liquidity as COVID-19 impacts continue to be felt across the global economy. Yields from the fixed income portfolio are dependent on future market forces, monetary policy and interest rate policy from the Federal Reserve. Unrealized gains on our equity securities were again driven by market fluctuations, resulting in a favorable outcome for the quarter and an unfavorable outcome for the first half of 2020.
Capital Deployment
During the second quarter, the Company repurchased approximately 572 thousand shares at an aggregate cost of $10.0 million. For 1H20, the Company repurchased approximately 884 thousand shares at an aggregate cost of $16.6 million. The Company’s current share repurchase authorization program has $11.7 million remaining as of June 30, 2020 and runs through December 31, 2021.
On July 6, 2020 the Board of Directors declared a quarterly cash dividend of 16 cents per share, payable on August 7, 2020, to shareholders of record as of the close of business on July 31, 2020.
Guidance
The Company is updating its guidance for 2020 to reflect the previously announced historically above average second quarter weather events (assuming no further extraordinary weather events in 2H20):
- GAAP EPS in a range of $2.31 – $2.61 (reduced from previous range of $2.80 – $3.10)
- Non-GAAP Adjusted EPS in a range of $2.40 – $2.70 (reduced from previous range of $2.80 – $3.10)
- Annualized return on average equity (derived from GAAP measures) in a range of 13.5% – 16.5% (reduced from previous range of 17% – 20%)
Conference Call and Webcast
- Thursday, July 30, 2020 at 9:00 a.m. ET
- U.S. Dial-in Number: (855) 752-6647
- International: (503) 343-6667
- Participant code: 9294332
- Listen to live webcast and view presentation: UniversalInsuranceHoldings.com
- Replay of the call will be available on the UVE website and by phone at (855) 859-2056 or internationally at (404) 537-3406 using the participant code: 9294332 through August 14, 2020
About Universal Insurance Holdings, Inc.
Universal Insurance Holdings, Inc. (“UVE”) is a holding company offering property and casualty insurance and value-added insurance services. We develop, market, and write insurance products for consumers predominantly in the personal residential homeowners lines of business and perform substantially all other insurance-related services for our primary insurance entities, including risk management, claims management and distribution. We sell insurance products through both our appointed independent agents and through our direct online distribution channels in the United States across 18 states (primarily Florida). Learn more at UniversalInsuranceHoldings.com.
Non-GAAP Financial Measures and Key Performance Indicators
This press release contains non-GAAP financial measures within the meaning of Regulation G promulgated by the U.S. Securities and Exchange Commission (“SEC”), including adjusted earnings per diluted share, which excludes the impact of the net realized and unrealized gains and losses on investments as well as extraordinary reinstatement premiums and associated commissions. Extraordinary reinstatement premiums are not covered by reinstatement premium protection and attach just below the Florida Hurricane Catastrophe Fund (“FHCF”) reinsurance layer. Adjusted operating income excludes the impact of the net realized and unrealized gains and losses on investments, as well as interest expense and extraordinary reinstatement premiums and associated commissions. A “non-GAAP financial measure” is generally defined as a numerical measure of a company’s historical or future performance that excludes or includes amounts, or is subject to adjustments, so as to be different from the most directly comparable measure calculated and presented in accordance with generally accepted accounting principles (“GAAP”). UVE management believes that these non-GAAP financial measures, when considered together with the GAAP financial measures, provide information that is useful to investors in understanding period-over-period operating results separate and apart from items that may, or could, have a disproportionately positive or negative impact on results in any particular period. UVE management also believes that these non-GAAP financial measures enhance the ability of investors to analyze UVE’s business trends and to understand UVE’s performance. UVE’s management utilizes these non-GAAP financial measures as guides in long-term planning. Non-GAAP financial measures should be considered in addition to, and not as a substitute for or superior to, financial measures presented in accordance with GAAP. For more information regarding our key performance indicators, please refer to the section titled “Management’s Discussion and Analysis of Financial Condition and Results of Operations – Key Performance Indicators” in our forthcoming Quarterly Report on Form 10-Q for the quarter ended June 30, 2020.
Forward-Looking Statements
This press release may contain “forward-looking statements” within the meaning of the Private Securities Litigation Reform Act of 1995. The words “believe,” “expect,” “anticipate,” “will,” “plan,” and similar expressions identify forward-looking statements, which speak only as of the date the statement was made. Such statements may include commentary on plans, products and lines of business, marketing arrangements, reinsurance programs and other business developments and assumptions relating to the foregoing. Forward-looking statements are inherently subject to risks and uncertainties, some of which cannot be predicted or quantified, including those risks and uncertainties described under the heading “risk factors” in the Company’s Annual Report on Form 10-K and in the Company’s Quarterly Report on Form 10-Q for the quarter ended March 31, 2020, as well as in our other filings with the SEC. Future results could differ materially from those described, and the Company disclaims any intention or obligation to update or revise any forward-looking statements, whether as a result of new information, future events, or otherwise.
Investor Relations Contact:
Rob Luther, 954-958-1200 ext. 6750
VP, Corporate Development, Strategy & IR
Media Relations Contact:
Andy Brimmer / Mahmoud Siddig, 212-355-4449
Joele Frank, Wilkinson Brimmer Katcher