Universal Insurance Holdings Reports Third Quarter 2020 Results
- 3Q20 total revenue up 35.7% to $311.7 million
- 3Q20 direct premiums written up 19.4%
- 3Q20 diluted GAAP earnings per share (“EPS”) of $(0.10), non-GAAP adjusted EPS1 of $(1.43)
- Book value per share increased 0.1% since the end of 2019 to $15.15 despite elevated industry-wide weather activity
- YTD annualized return on average equity of 10.0%
1 Excludes net realized and unrealized gains and losses on investments as well as extraordinary reinstatement premiums and associated commissions (“non-GAAP adjusted EPS”). Reconciliations of GAAP to non-GAAP financial measures are provided in the attached tables.
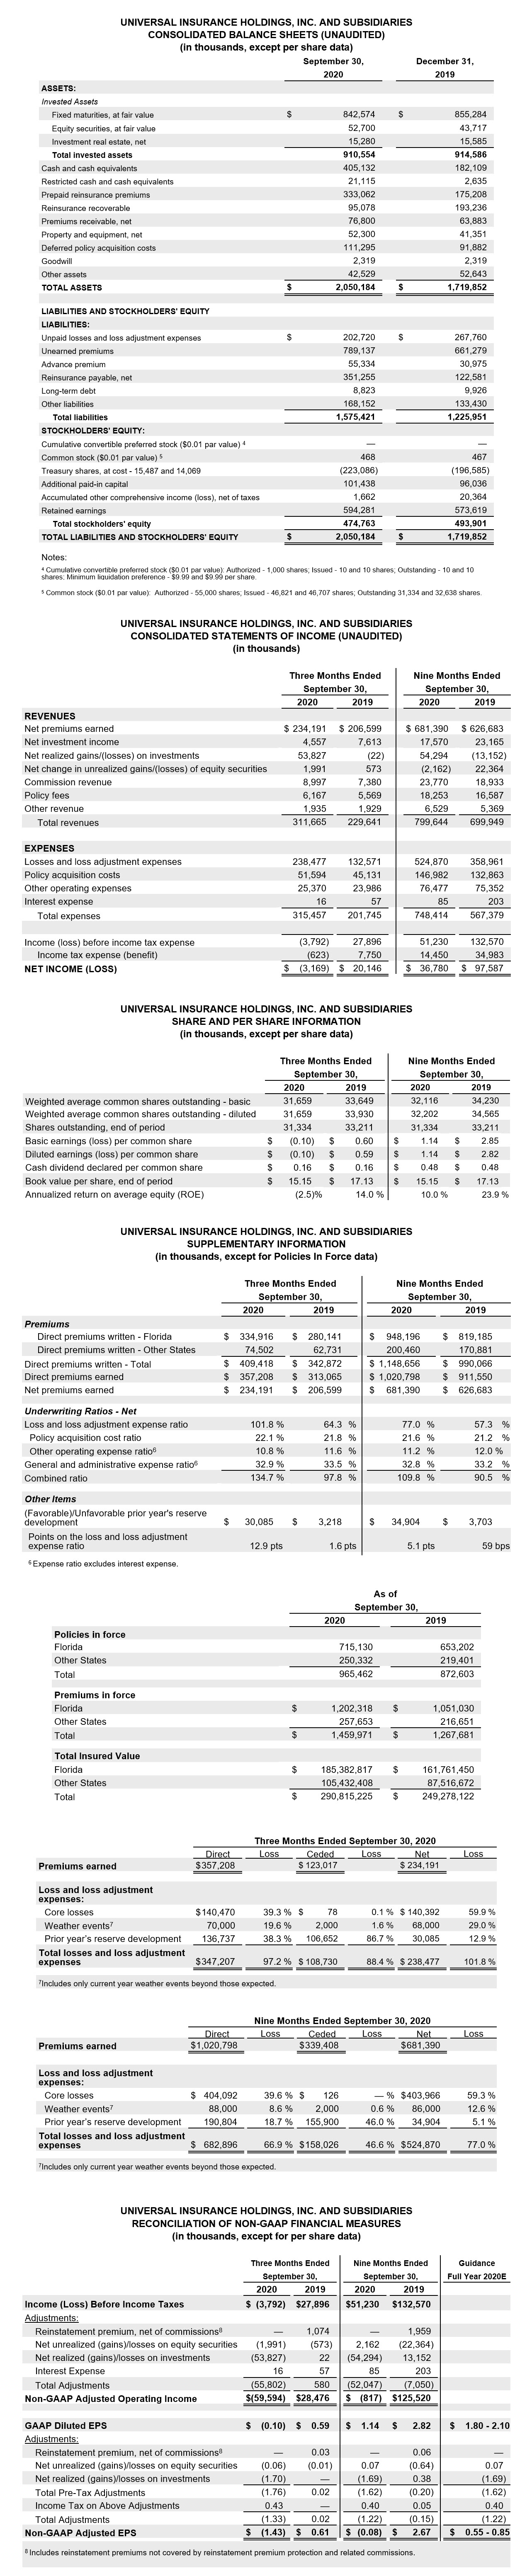
Fort Lauderdale, Fla., October 27, 2020 – Universal Insurance Holdings (NYSE: UVE) (the “Company”) reported 2020 third quarter diluted EPS of $(0.10) on a GAAP basis and $(1.43) non-GAAP adjusted EPS1 . Total revenue was up 35.7% from the year ago quarter to $311.7 million. Year-to-date annualized return on average equity was 10.0%.
“We continued to see headwinds in the third quarter as we dealt with elevated industry-wide weather events year-to-date. As previously announced, we were affected by full retention events from Hurricanes Isaias and Sally, in addition to other PCS events year-to-date. Furthermore, we saw an increase in prior year’s companion claims in the run up to the expiration of the statute of limitations for Hurricane Irma, which contributed to prior year’s reserve development,” said Stephen J. Donaghy, Chief Executive Officer.
“Our primary rate increases continue to flow through our book as evidenced by our strong direct premiums written growth of 19.4% in the quarter. We continue to selectively write new business in our existing states, including Florida. Specifically in Florida, we have seen a 9.5% year-over-year policy count growth, with 97% of this growth coming from outside of the tri-county area.”
Summary Financial Results
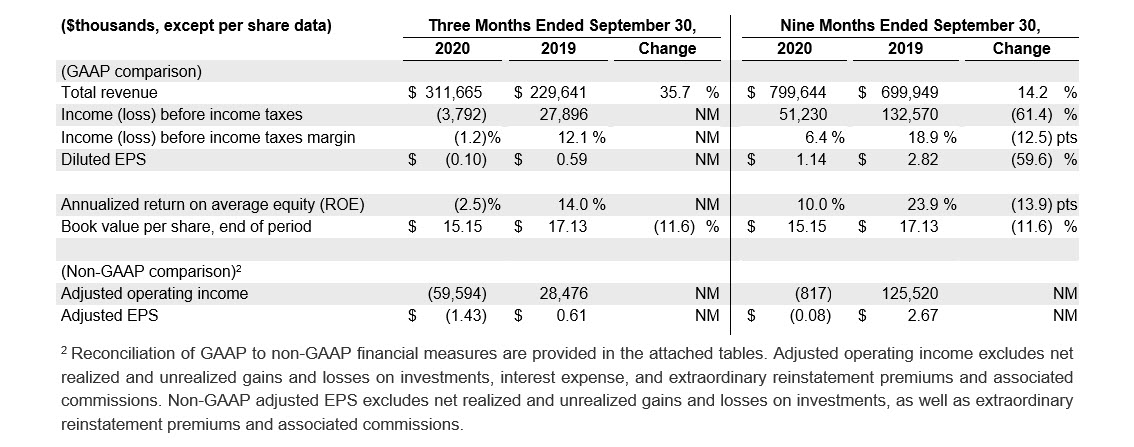
Total revenue grew double digits for the quarter driven primarily by realized gains on investments, growth in net premiums earned (organic new business growth and primary rate increases) and services revenue. GAAP diluted EPS and non-GAAP adjusted EPS results for the quarter were driven by increased loss and loss adjustment expense (“LAE”) from elevated industry-wide weather events and prior year’s reserve development. Despite elevated activity year-to-date, the Company produced an annualized year-to-date return on average equity of 10.0%.
Underwriting
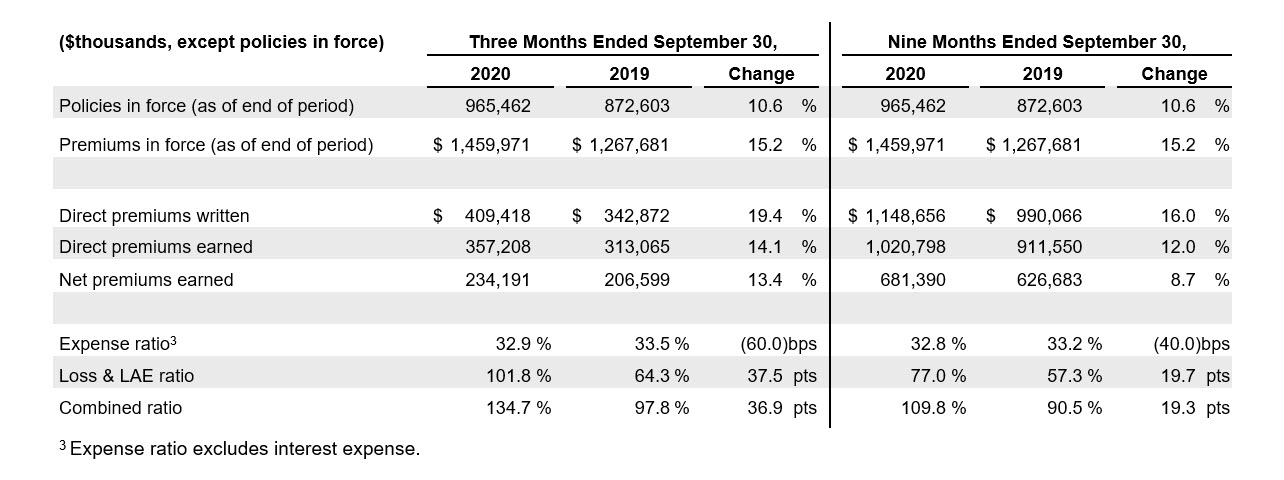
Direct premiums written were up double digits for the quarter, led by strong direct premium growth of 18.8% in Other States (non-Florida), and 19.6% in Florida. The quarter’s growth benefited from organic new business growth, and primary rate increases continuing to flow through the book.
On the expense side, the combined ratio increased 36.9 points for the quarter. The increase was driven primarily by increased weather events, accruing reserves at a higher core loss ratio, prior year’s reserve development, and the impact of higher reinsurance costs, partially offset by a benefit from our claims adjusting business and a reduction in the expense ratio as set forth below.
- The expense ratio improved by 60 basis points for the quarter, primarily related to an 80 basis point improvement in the other operating expense ratio due in large part to economies of scale and lower stock based compensation, partially offset by the effect of increased cost of reinsurance on the expense ratio.
- The net loss and LAE ratio increased 37.5 points for the quarter. Quarterly drivers include:
-
- Weather events in excess of plan of $68.0 million, or 29.0 points, for the quarter ($15.0 million in 3Q19) were primarily related to the previously announced hurricanes (Isaias and Sally), in addition to other PCS events that exceeded the plan year-to-date.
-
- Prior year’s reserve development of $30.1 million, or 12.9 points, for the quarter ($3.2 million in 3Q19) was partially related to increased prior year’s companion claims being filed during the run up to the expiration of the 3-year catastrophe statute of limitations in September.
-
- Core losses of $140.4 million, or 59.9 points, for the quarter ($114.4 million in 3Q19) were primarily related to accruing incremental reserves for the current accident year loss costs and diversified growth.
Services
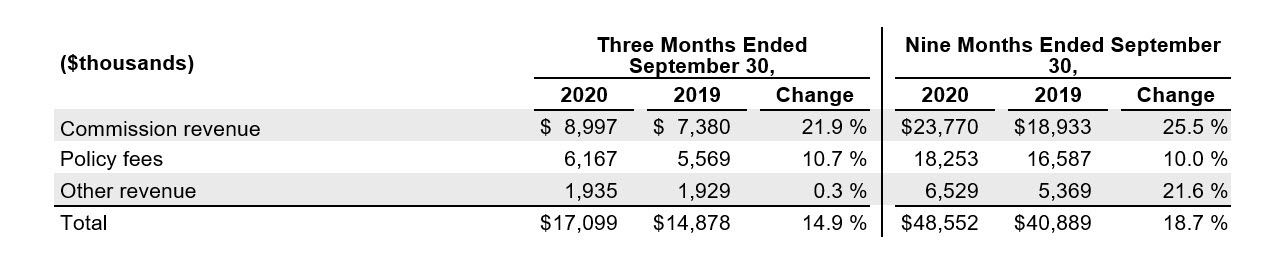
Total services revenue increased 14.9% for the quarter. The increase was driven by commission revenue earned on ceded premiums and an increase in policy fees.
Investments
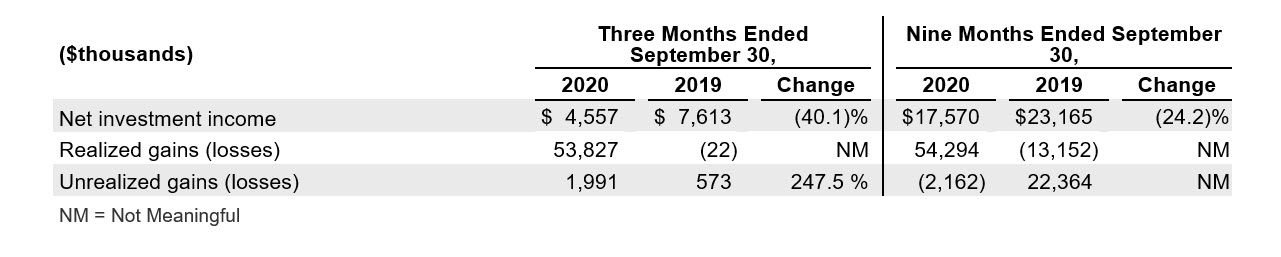
Net investment income decreased 40.1% for the quarter, driven by lower yields on cash and fixed-income investments during 2020 when compared to 2019. Realized gains for the quarter resulted from taking advantage of increased market prices on our available-for-sale debt investment portfolio. Cash and cash equivalents increased 122.5% to $405.1 million when compared to the end of 2019 as a result of the actions taken to realize investment gains, leading to higher investment cash flows. As a result of the sales and reinvestment, future portfolio investment income will reflect current market rates.
Capital Deployment
During the third quarter, the Company repurchased approximately 534 thousand shares at an aggregate cost of $9.9 million. Year-to-date, the Company repurchased approximately 1.4 million shares at an aggregate cost of $26.5 million.
On July 6, 2020, the Board of Directors declared a quarterly cash dividend of 16 cents per share of common stock, which was paid on August 7, 2020, to shareholders of record as of the close of business on July 31, 2020.
Guidance
The Company is updating its guidance for 2020 to reflect increased top line revenue, offset by elevated third quarter loss and LAE (assuming no further extraordinary weather events and no realized or unrealized gains in 4Q20):
- GAAP EPS in a range of $1.80 – $2.10 (reduced from previous range of $2.31 – $2.61)
- Non-GAAP Adjusted EPS in a range of $0.55 – $0.85 (reduced from previous range of $2.40 – $2.70)
- Annualized return on average equity (derived from GAAP measures) in a range of 11.1% – 14.1% (reduced from previous range of 13.5% – 16.5%)
Conference Call and Webcast
- Wednesday, October 28, 2020 at 9:00 a.m. ET
- S. Dial-in Number: (855) 752-6647
- International: (503) 343-6667
- Participant code: 5317328
- Listen to live webcast and view presentation: UniversalInsuranceHoldings.com
- Replay of the call will be available on the UVE website and by phone at (855) 859-2056 or internationally at (404) 537-3406 using the participant code: 5317328 through November 12, 2020
About Universal Insurance Holdings, Inc.
Universal Insurance Holdings, Inc. (“UVE”) is a holding company offering property and casualty insurance and value-added insurance services. We develop, market, and write insurance products for consumers predominantly in the personal residential homeowners lines of business and perform substantially all other insurance-related services for our primary insurance entities, including risk management, claims management and distribution. We sell insurance products through both our appointed independent agents and through our direct online distribution channels in the United States across 18 states (primarily Florida). Learn more at UniversalInsuranceHoldings.com.
Non-GAAP Financial Measures and Key Performance Indicators
This press release contains non-GAAP financial measures within the meaning of Regulation G promulgated by the U.S. Securities and Exchange Commission (“SEC”), including adjusted earnings per diluted share, which excludes the impact of the net realized and unrealized gains and losses on investments as well as extraordinary reinstatement premiums and associated commissions. Extraordinary reinstatement premiums are not covered by reinstatement premium protection and attach just below the Florida Hurricane Catastrophe Fund (“FHCF”) reinsurance layer. Adjusted operating income excludes the impact of the net realized and unrealized gains and losses on investments, as well as interest expense and extraordinary reinstatement premiums and associated commissions. A “non-GAAP financial measure” is generally defined as a numerical measure of a company’s historical or future performance that excludes or includes amounts, or is subject to adjustments, so as to be different from the most directly comparable measure calculated and presented in accordance with generally accepted accounting principles (“GAAP”). UVE management believes that these non-GAAP financial measures, when considered together with the GAAP financial measures, provide information that is useful to investors in understanding period-over-period operating results separate and apart from items that may, or could, have a disproportionately positive or negative impact on results in any particular period. UVE management also believes that these non-GAAP financial measures enhance the ability of investors to analyze UVE’s business trends and to understand UVE’s performance. UVE’s management utilizes these non-GAAP financial measures as guides in long-term planning. Non-GAAP financial measures should be considered in addition to, and not as a substitute for or superior to, financial measures presented in accordance with GAAP. For more information regarding our key performance indicators, please refer to the section titled “Management’s Discussion and Analysis of Financial Condition and Results of Operations – Key Performance Indicators” in our forthcoming Quarterly Report on Form 10-Q for the quarter ended September 30, 2020.
Forward-Looking Statements
This press release may contain “forward-looking statements” within the meaning of the Private Securities Litigation Reform Act of 1995. The words “believe,” “expect,” “anticipate,” “will,” “plan,” and similar expressions identify forward-looking statements, which speak only as of the date the statement was made. Such statements may include commentary on plans, products and lines of business, marketing arrangements, reinsurance programs and other business developments and assumptions relating to the foregoing. Forward-looking statements are inherently subject to risks and uncertainties, some of which cannot be predicted or quantified, including those risks and uncertainties described under the heading “Risk Factors” and “Liquidity and Capital Resources” in our 2019 Annual Report on Form 10-K, and supplemented in our subsequent Quarterly Reports on Form 10-Q. Future results could differ materially from those described, and the Company disclaims any intention or obligation to update or revise any forward-looking statements, whether as a result of new information, future events, or otherwise. For further information regarding risk factors that could affect the Company’s operations and future results, refer to the Company’s reports filed with the Securities and Exchange Commission, including the Company’s Annual Report on Form 10-K and the most recent quarterly reports on Form 10-Q.
Investor Relations Contact:
Rob Luther, 954-958-1200 ext. 6750
VP, Corporate Development, Strategy & IR
rluther@universalproperty.com
Media Relations Contact:
Andy Brimmer / Mahmoud Siddig, 212-355-4449
Joele Frank, Wilkinson Brimmer Katcher