Universal Insurance Holdings Reports Fourth Quarter 2019 Results; Well-Positioned on EPS and ROAE guidance for 2020
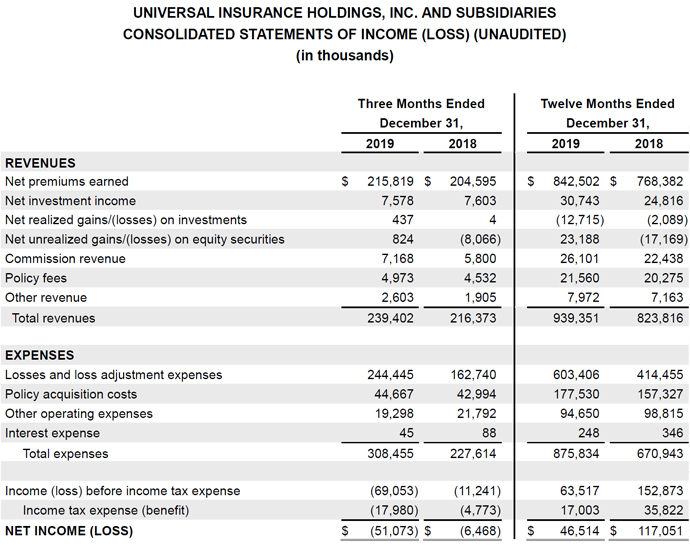
- 4Q19 total revenue up 10.6% to $239.4 million; FY19 up 14.0% to $939.4 million
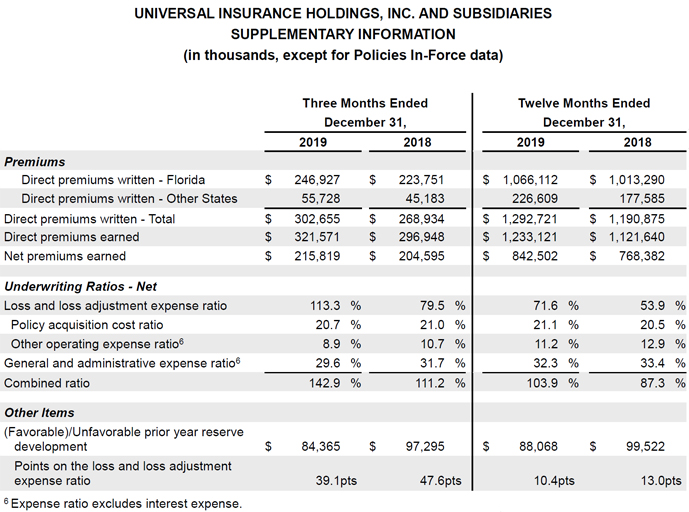
- 4Q19 other states direct premiums written up 23.3%; FY19 other states up 27.6%
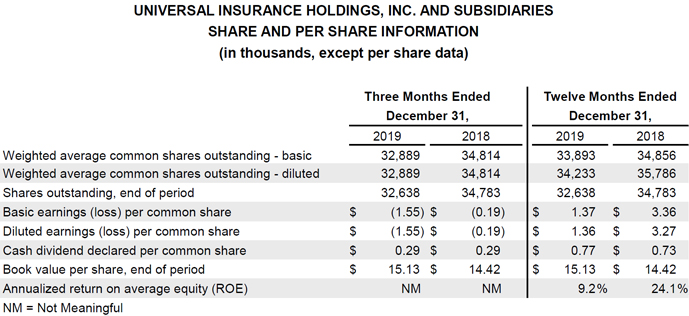
- 4Q19 diluted GAAP earnings per share (EPS) of $(1.55), non-GAAP adjusted EPS1 of $(1.57)
- FY19 diluted GAAP EPS of $1.36, non-GAAP adjusted EPS1 of $1.18
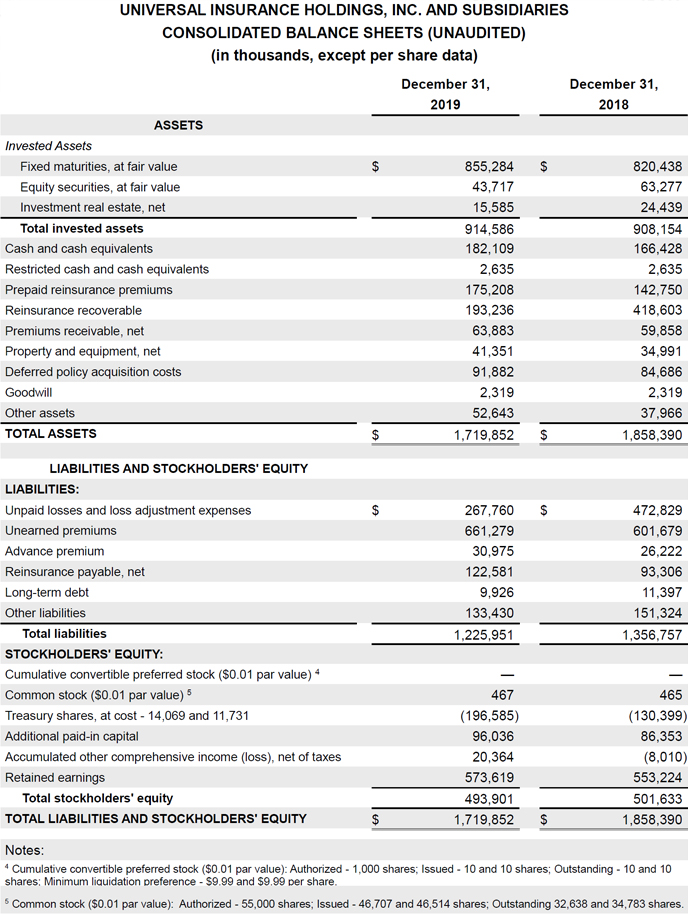
- FY19 return on average equity of 9.2%; Debt-to-equity ratio of 2.0%
- Full year EPS driven by 4Q19 pre-tax charges, $43.7 million in prior years adverse development, $40.7 million reduction in prior years anticipated subrogation recoveries, $24.7 million in current year strengthening, and $16.7 million in strengthening for current year weather events above plan
- FY19 returned a record $92.3 million to shareholders through share repurchases and dividends
- UPCIC filed for a 12.4% overall primary rate increase in Florida
- Over 75% of reinsurance capacity for June 1st, 2020 renewals already secured
- Initiating FY20 guidance: GAAP and non-GAAP adjusted EPS1 of $2.80 – $3.10 (assuming no extraordinary weather events in 2020); ROAE 17% – 20%
(1) Excludes net realized and unrealized gains and losses on investments as well as extraordinary reinstatement premiums and associated commissions (“non-GAAP adjusted EPS”). Reconciliations of GAAP to non-GAAP financial measures are provided in the attached tables.
Fort Lauderdale, Fla., March 2, 2020 – Universal Insurance Holdings (NYSE: UVE) (the “Company”) reported 2019 fourth quarter diluted EPS of $(1.55) on a GAAP basis and $(1.57) non-GAAP adjusted EPS1. Quarterly direct premiums written were up 12.5% from the year-ago quarter to $302.7 million. Book value per share grew to $15.13, an increase of 4.9% with a return on average equity of 9.2% for the year.
“We ended the year with strong top line growth thanks to our effective marketing strategy, agent relations and customer service,” said Stephen J. Donaghy, Chief Executive Officer. “Since taking over as CEO in July of 2019, we have continued to respond to the well-documented current Florida dynamics that have affected all industry participants. In spite of these challenges, we produced an annualized return on average equity of 9.2%. This annual result includes enhanced conservatism across many different fronts, including the run up of claims prior to the effective date of new AOB legislation, the impact of a hardening reinsurance market, and the overall influence of social inflation. We focused on prior and current years along with our subrogation expectation even though 2019 was our highest subrogation receivable in company history. Our financial strength, along with filing for double digit primary rate increases in Florida and our direct to consumer platform, CloveredSM, have positioned us for long-term, sustainable bottom line growth going forward into 2020 and beyond. We believe the diligent work we have put forth, puts us in position to provide FY20 guidance of a GAAP and non-GAAP adjusted EPS range of $2.80 – $3.10 assuming no extraordinary weather events in 2020, and a Return on Average Equity of 17% – 20%.”
Summary Financial Results
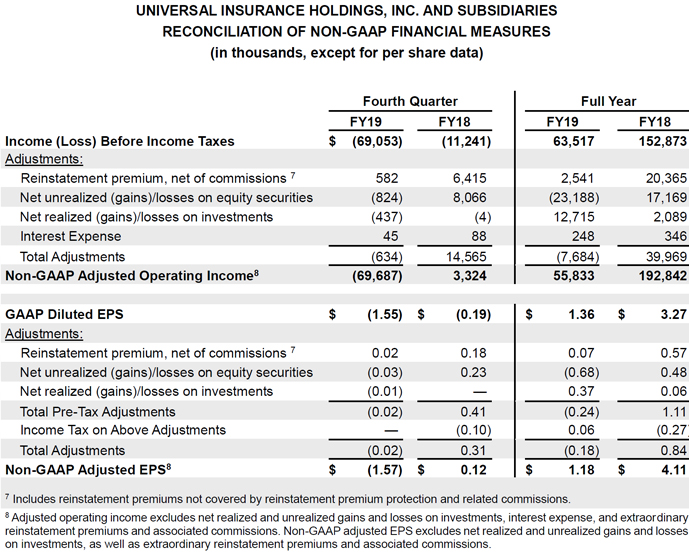
2 Reconciliation of GAAP to non-GAAP financial measures are provided in the attached tables. Adjusted operating income excludes net realized and unrealized gains and losses on investments, interest expense, and extraordinary reinstatement premiums and associated commissions. Non-GAAP adjusted EPS excludes net realized and unrealized gains and losses on investments, as well as extraordinary reinstatement premiums and associated commissions.
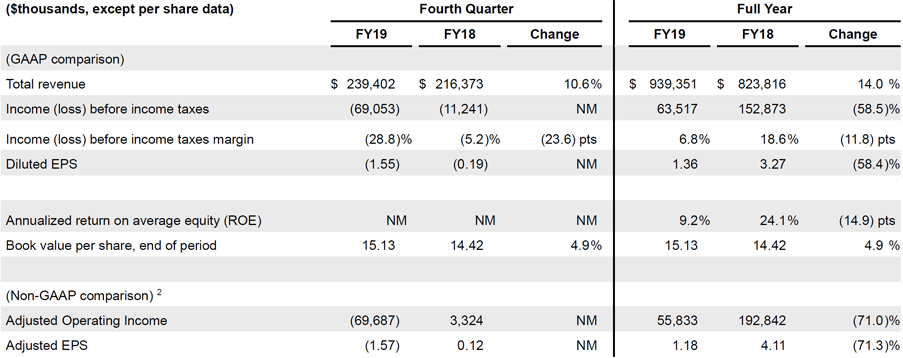
NM = Not Meaningful
Total revenue grew double digits for both the quarter and the year, driven primarily by higher organic premium volume and retention due to our marketing and customer service efforts, premium pricing flowing through the book, and our investment portfolio performance, partially offset by increased reinsurance costs. Income before income tax was down 58.5% for the year and adjusted operating income was down 71.0% for the year, primarily impacted by a lower benefit from our claims adjusting business as prior years’ catastrophe claims conclude, current year reserve strengthening, and current year weather events above plan. Income before income tax produced a 6.8% margin for the year. GAAP diluted EPS and non-GAAP adjusted EPS results for the quarter and the year benefited from premium growth, investment performance, and commission revenue, offset by the aforementioned items. The Company produced an annualized return on average equity of 9.2% and book value per share growth of 4.9% for the year, despite where the industry sits in the current cycle and the number of factors affecting Florida.
Underwriting
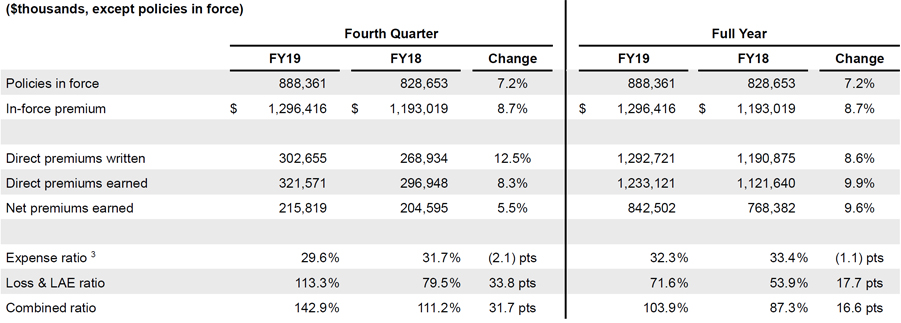
3 Expense ratio excludes interest expense.
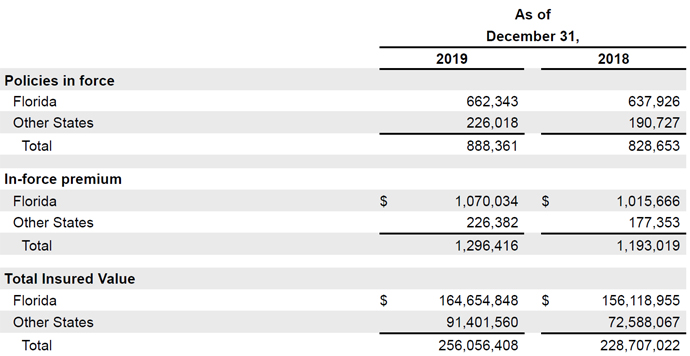
Direct premiums written were up double digits for the quarter, led by the continued impact of rate increases in Florida and other states, as well as strong direct premium growth of 23.3% in Other States (non-Florida). For the year, direct premiums written were up 8.6% led by the rate increases, as well as strong direct premium growth of 27.6% in Other States and a slightly improved policy retention.
On the expense side, the combined ratio increased 31.7 points for the quarter and 16.6 points for the year. The increases were driven primarily by reduced benefits from claim settlement fees as prior years’ catastrophe claims conclude, conservatism on prior years’ anticipated subrogation recoveries, current year reserve strengthening, and weather events above plan, partially offset by an improvement in the expense ratio as set forth below:
- The expense ratio improved 2.1 points for the quarter driven by a 1.8 point improvement in the other operating expense ratio, further aided by a 30 basis point decrease in the policy acquisition cost ratio. For the year, the expense ratio improved 1.1 points driven by a 1.7 point improvement in the other operating expense ratio, partially offset by a 60 basis point increase in the policy acquisition cost ratio.
- The net loss and loss adjustment expense ratio increased 33.8 points for the quarter and 17.7 points for the year. Quarterly and full year drivers for 2019 include:
-
- – Prior year reserve development was primarily made up of a $40.7 million reduction in anticipated subrogation recoveries in the fourth quarter, and $43.7 million of prior accident years adverse development in the fourth quarter resulting in a total of $84.4 million or 39.1 points for the quarter and $88.1 million or 10.4 points for the year.
- – Weather events in excess of plan of $16.7 million or 7.7 points ($9.8 million in 4Q18) for the quarter were directly related to strengthening IBNR for weather events in 2019. For the full year, weather events in excess of plan were $38.7 million or 4.6 points ($14.8 million in FY18).
- – All other losses and loss adjustment expense of $143.4 million or 66.5 points for the quarter and $476.7 million or 56.6 points for the year, were primarily related to diversified growth, $24.7 million in the fourth quarter of incremental reserve strengthening for accident year 2019 as the industry continues to see increased severity in represented claims, and a reduced benefit from our adjusting business as prior years’ catastrophe claims conclude.
Services
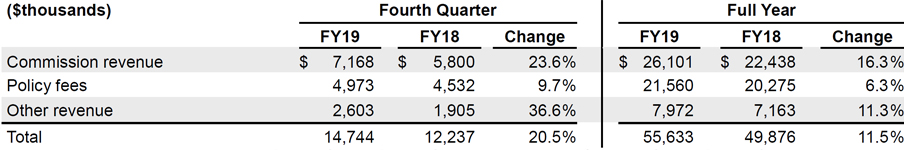
Total services revenue increased 20.5% for the quarter and 11.5% for the full year. The increase was driven by commission revenue earned on ceded premiums and an increase in policy fees and other revenue related to volume.
Investments
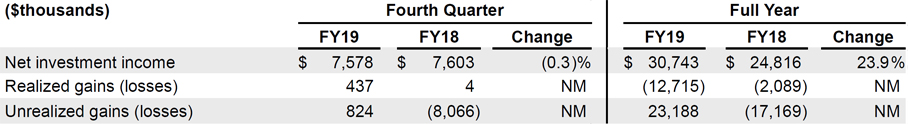
NM = Not Meaningful
Net investment income decreased 0.3% for the quarter, but increased 23.9% for the year, primarily due to increased assets under management and an asset mix shift to higher yielding investment grade bonds during 2018 and 2019. These results were partially offset by a lower trend in yields on cash and short term investments during the second half of 2019. Realized losses in 2019 resulted primarily from the sale of equity securities. Unrealized gains were driven by market volatility in equity securities.
Capital Deployment
During the fourth quarter, the Company repurchased approximately 567 thousand shares at an aggregate cost of $16.3 million. For the full year the Company repurchased approximately 2.3 million shares at an aggregate cost of $66.2 million. The Company’s current share repurchase authorization program has $28.3 million remaining as of December 31, 2019 and runs through December 31, 2021.
On February 11th, 2020 the Board of Directors of the Company declared a quarterly cash dividend of 16 cents per share of common stock, payable March 19, 2020, to shareholders of record as of the close of business on March 12, 2020.
Guidance
Universal initiated the following guidance for fiscal 2020:
- GAAP and Non-GAAP Adjusted EPS in a range of $2.80 – $3.10 (assuming no extraordinary weather events in 2020)
- Annualized return on average equity in a range of 17% – 20%
Conference Call and Webcast
- Tuesday, March 3, 2020 at 9:00 a.m. ET
- U.S. Dial-in Number: (855) 752-6647
- International: (503) 343-6667
- Participant code: 4299054
- Listen to live webcast and view presentation: UniversalInsuranceHoldings.com
- Replay of the call will be available on the UVE website and by phone at (855) 859-2056 or internationally at (404) 537-3406 using the participant code: 4299054 through March 18, 2020
About Universal Insurance Holdings, Inc.
Universal Insurance Holdings (UVE) is a holding company offering property and casualty insurance and value-added insurance services. We develop, market, and write insurance products for consumers predominantly in the personal residential homeowners lines of business and perform substantially all other insurance-related services for our primary insurance entities, including risk management, claims management and distribution. We sell insurance products through both our appointed independent agents and through our direct online distribution channels in the United States across 18 states (primarily Florida). Learn more at UniversalInsuranceHoldings.com.
Non-GAAP Financial Measures
This press release contains non-GAAP financial measures within the meaning of Regulation G promulgated by the U.S. Securities and Exchange Commission (“SEC”), including adjusted earnings per diluted share, which excludes the impact of the net realized and unrealized gains and losses on investments as well as extraordinary reinstatement premiums and associated commissions. Extraordinary reinstatement premiums are not covered by reinstatement premium protection and attach just below the Florida Hurricane Catastrophe Fund (“FHCF”) reinsurance layer. Adjusted operating income excludes the impact of the net realized and unrealized gains and losses on investments, as well as interest expense and extraordinary reinstatement premiums and associated commissions. A “non-GAAP financial measure” is generally defined as a numerical measure of a company’s historical or future performance that excludes or includes amounts, or is subject to adjustments, so as to be different from the most directly comparable measure calculated and presented in accordance with generally accepted accounting principles (“GAAP”). UVE management believes that these non-GAAP financial measures, when considered together with the GAAP financial measures, provide information that is useful to investors in understanding period-over-period operating results separate and apart from items that may, or could, have a disproportionately positive or negative impact on results in any particular period. UVE management also believes that these non-GAAP financial measures enhance the ability of investors to analyze UVE’s business trends and to understand UVE’s performance. UVE’s management utilizes these non-GAAP financial measures as guides in long-term planning. Non-GAAP financial measures should be considered in addition to, and not as a substitute for or superior to, financial measures presented in accordance with GAAP.
Forward-Looking Statements
This press release may contain “forward-looking statements” within the meaning of the Private Securities Litigation Reform Act of 1995. The words “believe,” “expect,” “predict,” “project,” “should,” “anticipate,” “will,” “plan,” and similar expressions identify forward-looking statements, which speak only as of the date the statements were made and include, but are not limited to, statements regarding the outlook for the Company’s future business and financial performance. Such statements may also include commentary on plans, products and lines of business, marketing arrangements, reinsurance programs and other business developments and assumptions relating to the foregoing. Such forward-looking statements are based on the current beliefs of our management as well as assumptions made by and information currently available to them, which are subject to inherent uncertainties, risks and changes in circumstances that are difficult to predict. Future results could differ materially from those described, and the Company disclaims any intention or obligation to update or revise any forward-looking statements, whether as a result of new information, future events, or otherwise. For further information regarding risk factors that could affect the Company’s operations and future results, refer to the Company’s reports filed with the Securities and Exchange Commission, including the Company’s Annual Report on Form 10-K.
Investor Relations Contact:
Rob Luther 954-958-1200 Ext. 6750
VP, Corporate Development, Strategy & IR
rluther@universalproperty.com
Media Relations Contact:
Andy Brimmer / Mahmoud Siddig 212-355-4449
Joele Frank, Wilkinson Brimmer Katcher