
Universal Insurance Holdings Reports Second Quarter 2019 Results
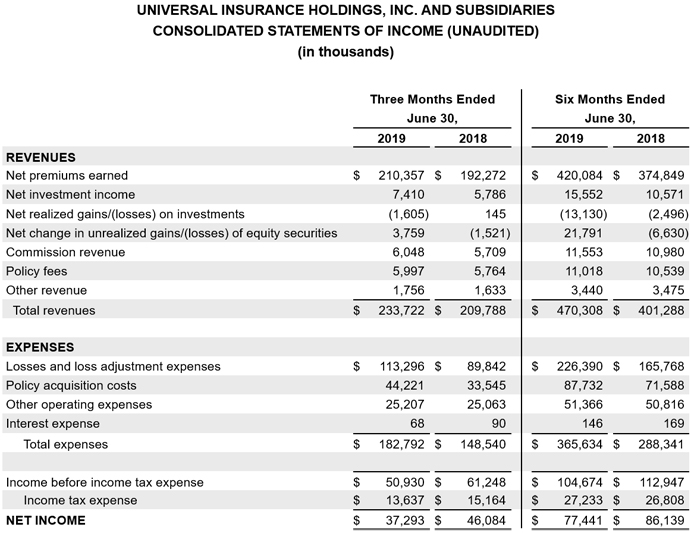
- 2Q19 total revenue up 11.4% to $233.7 million; 1H19 up 17.2% to $470.3 million
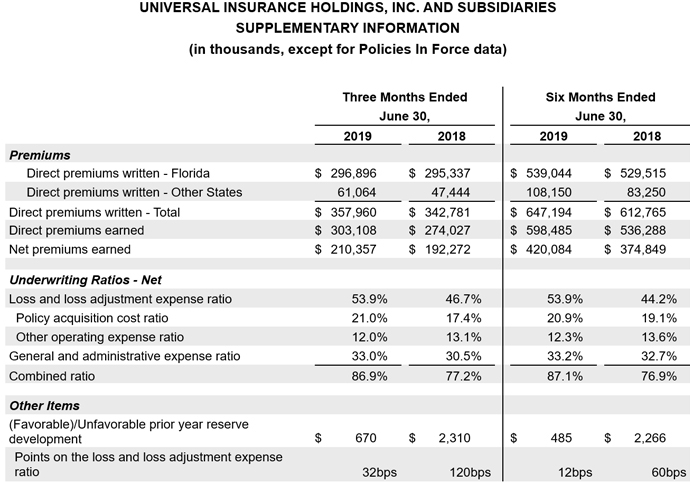
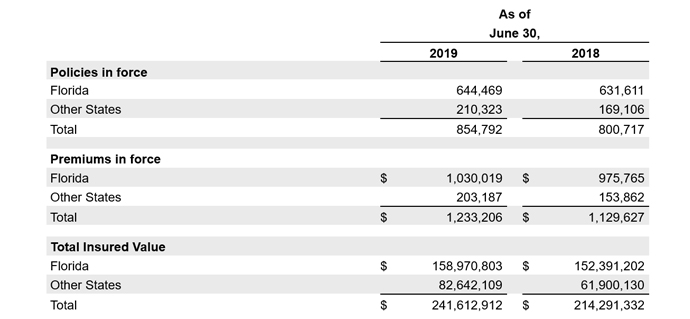
- 2Q19 direct premiums written (“DPW”) up 4.4% to $358.0 million; 1H19 up 5.6% to $647.2 million
- 2Q19 other states (non-Florida) DPW up 28.7%; 1H19 up 29.9%
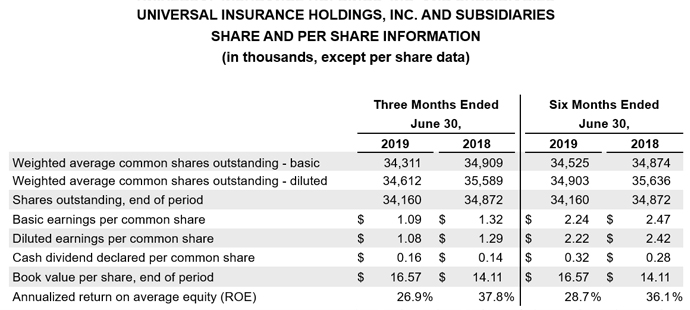
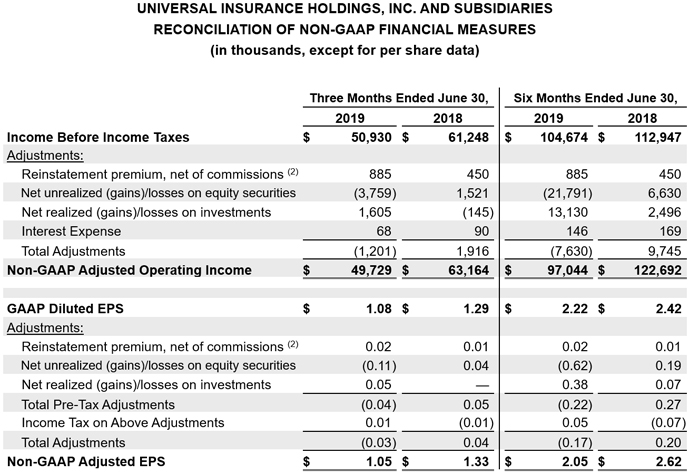
- 2Q19 diluted GAAP earnings per share (“EPS”) of $1.08, non-GAAP adjusted EPS1 of $1.05
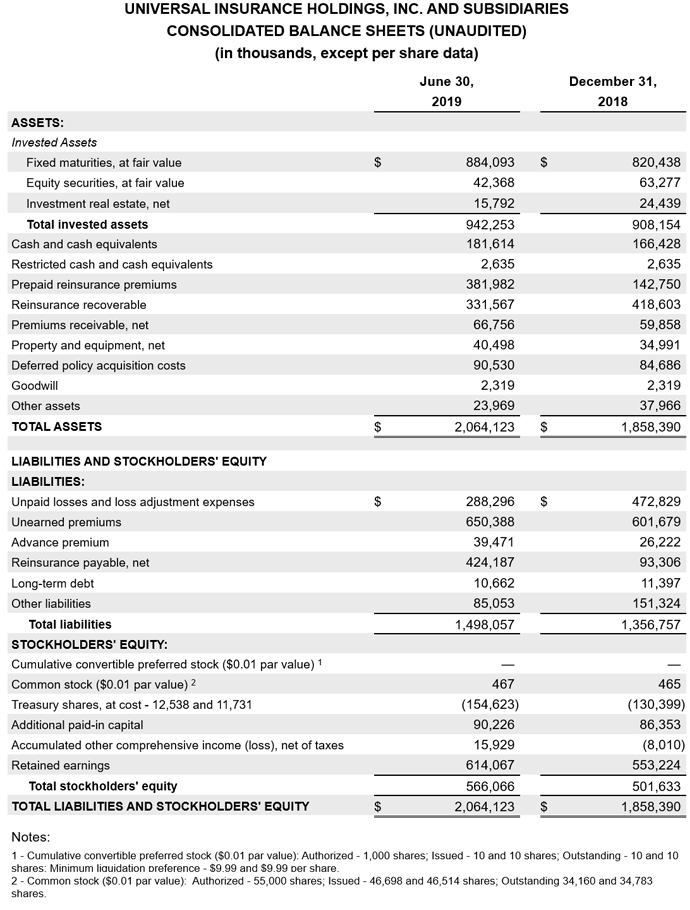
- Year-over-year book value per share up 17.4% to $16.57
- 1H19 diluted GAAP EPS of $2.22, non-GAAP adjusted EPS1 of $2.05
- 1H19 combined ratio of 87.1%
- 1H19 annualized return on average equity of 28.7%
(1) Excludes net realized and unrealized gains and losses on investments as well as extraordinary reinstatement premiums and associated commissions (“non-GAAP adjusted EPS”). Reconciliations of GAAP to non-GAAP financial measures are provided in the attached tables.
Fort Lauderdale, Fla., July 31, 2019 – Universal Insurance Holdings (NYSE: UVE) (the “Company”) reported 2019 second quarter diluted EPS of $1.08 on a GAAP basis and $1.05 non-GAAP adjusted EPS.1 Total revenue was up 11.4% from the year-ago quarter to $233.7 million. Book value per share grew to $16.57, an increase of 17.4% year over year, with a 1H19 annualized return on average equity of 28.7%.
“These results extend our solid first quarter, with total revenue growing double digits for both the second quarter and the first half of 2019, resulting in a total annualized return on average equity in the first half of 2019 of 28.7%,” said Stephen J. Donaghy, Chief Executive Officer.
“In addition, we completed our 2019-2020 Reinsurance Program to secure more catastrophe coverage than at any point in the Company’s history. We also continued to expand our addressable market in the second quarter with Universal Property becoming licensed in Wisconsin. Lastly, our digital insurance distribution channel, CloveredSM, continued its expansion, becoming licensed in more than 15 states and adding five additional carrier appointments across Homeowners, Auto, Flood, and E&S lines. These milestones mark continued progress at the half-way point of 2019 against our strategic priorities.”
Summary Financial Results
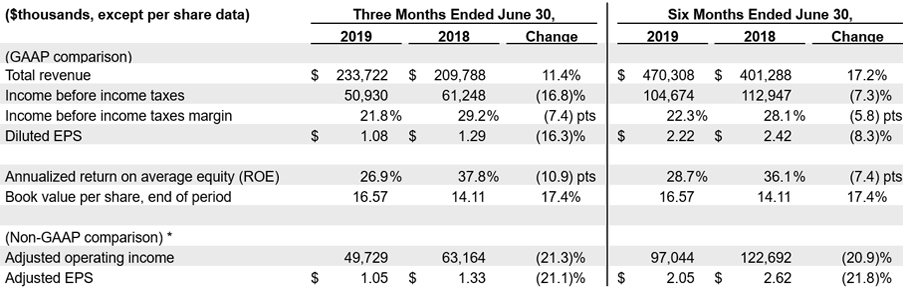
*Reconciliation of GAAP to non-GAAP financial measures are provided in the attached tables. Adjusted operating income excludes net realized and unrealized gains and losses on investments, interest expense, and extraordinary reinstatement premiums and associated commissions. Non-GAAP adjusted EPS excludes net realized and unrealized gains and losses on investments, as well as extraordinary reinstatement premiums and associated commissions.
Total revenue grew double digits for both the quarter and 1H19, driven primarily by higher organic premium volume, pricing, and investment portfolio performance. Income before income tax produced a 21.8% margin for the quarter and 22.3% for 1H19, bolstered by our investment portfolio and integrated services businesses. GAAP diluted EPS and non-GAAP adjusted EPS results reflect the positive momentum from premium growth and investment performance, but declined for the second quarter and 1H19 when compared to the same periods of 2018. The decline was driven by a higher core booked loss ratio in 2019 when compared to 2018 to bolster our reserve position, a lower benefit from integrated services as prior years’ claims conclude, and a higher effective tax rate. In addition, the EPS decline relative to 2018 was driven by a pre-tax $6.5 million non-recurring benefit in policy acquisition costs in the second quarter of 2018. The Company produced a strong annualized 1H19 return on average equity of 28.7% and book value per share growth of 17.4% year over year.
Underwriting
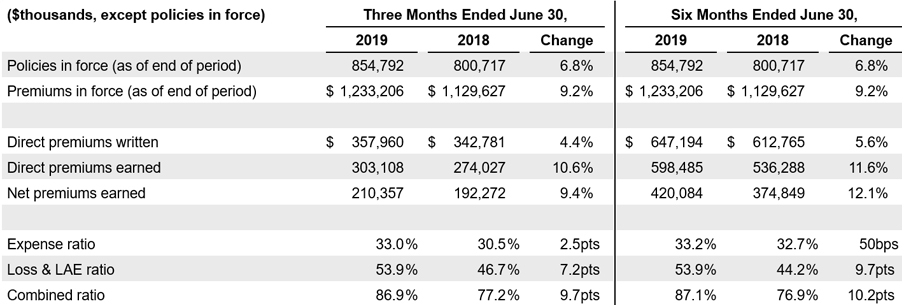
Direct premiums earned were up double digits for the quarter, led by growth of 33.2% in Other States (non-Florida). For 1H19, direct premiums earned were also up double digits led by 33.9% growth in Other States. Underlying growth in Florida was tempered by more disciplined underwriting guidelines that were put in place in 2019, while Other States geographic expansion continues to be strong.
On the expense side, the combined ratio increased 9.7 points for the quarter and 10.2 points for 1H19. The increases are driven by increased losses in connection with the diversified growth in the company’s underlying business, increased core booked loss ratios to bolster reserves, and a reduced benefit from our claims adjusting business, in addition to an increase in the expense ratio as set forth below:
- The expense ratio increased 2.5 points for the quarter. The increase was driven by a 3.6 point increase in the policy acquisition cost ratio, which was partially offset by a 1.1 point improvement in the other operating expense ratio. For 1H19, the expense ratio increased by 50 basis points. The increase was driven by a 1.8 point increase in the policy acquisition cost ratio, which was partially offset by a 1.3 point improvement in the other operating expense ratio.
-
- – The increase in policy acquisition costs for the quarter and 1H19 relative to 2018 was due to a non-recurring benefit of $6.5 million recorded in the second quarter of 2018 related to a refund of prior year premium taxes as a result of a settlement with the Florida Department of Revenue.
- – Excluding the non-recurring benefit in the prior year comparison, the expense ratio for the second quarter would have improved 90 basis points and 1.2 points for 1H19 in comparison to the same periods in 2018 due to scale benefits and reduced executive compensation.
- The net loss and loss adjustment expense (“LAE”) ratio increased 7.2 points for the quarter and 9.7 points for 1H19. Quarterly and 1H19 drivers include:
-
- – Weather events in excess of plan of $2 million or 1.0 point ($5 million in 2Q18) for the quarter was related to a series of wind events in southeastern states. For 1H19, weather events in excess of plan were $7.0 million or 1.7 points ($5 million in 1H18).
- – Prior year reserve development of $670 thousand or 30 basis points for the quarter and $485 thousand or 10 basis points for 1H19 were primarily related to increased net losses and LAE for Hurricane Matthew.
- – All other losses and loss adjustment expense of $110.6 million or 52.6 points for the quarter, and $218.9 million or 52.1 points for 1H19, include diversified growth, an increase in our estimated losses to bolster reserves, and a reduced benefit from our adjusting business as prior years’ claims conclude.
Services
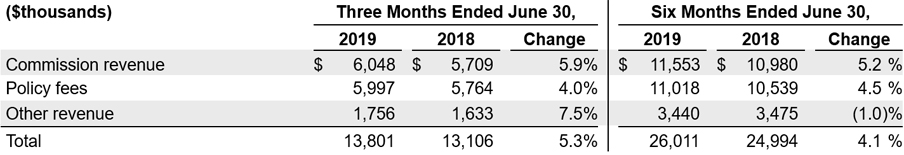
Total services revenue increased 5.3% for the quarter and 4.1% for 1H19. The increase was driven by commission revenue earned on ceded premiums and an increase in policy fees related to volume.
Investments
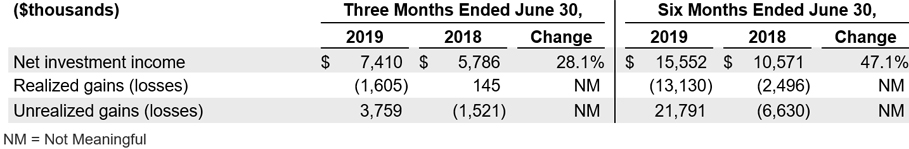
Net investment income increased 28.1% for the quarter and 47.1% in 1H19 due to higher long-term and short-term interest rates, asset mix, as well as higher average levels of invested assets. Yields from the fixed income portfolio are dependent on future market forces, monetary policy and interest rate policy from the Federal Reserve. Realized losses for the quarter and 1H19 were the result of liquidating underperforming equity securities. Unrealized gains were driven by market fluctuations in equity securities resulting in a favorable outcome for the quarter and 1H19.
Capital Deployment
During the second quarter, the Company repurchased approximately 486 thousand shares at an aggregate cost of $14.1 million. For 1H19, the Company repurchased approximately 806 thousand shares at an aggregate cost of $24.2 million. The Company’s current share repurchase authorization program has $30.3 million remaining as of June 30, 2019 and runs through December 31, 2020.
On June 5, 2019, the Board of Directors of the Company declared a quarterly cash dividend of 16 cents per share, which was paid on July 17, 2019, to shareholders of record as of the close of business on July 3, 2019.
Conference Call and Webcast
- Thursday, August 1, 2019 at 8:30 a.m. ET
- U.S Dial-in Number: (855) 752-6647
- International: (503) 343-6667
- Participant code: 2697643
- Listen to live webcast and view presentation: UniversalInsuranceHoldings.com
- Replay of the call will be available on the UVE website and by phone at (855) 859-2056 or internationally at (404) 537-3406 using the participant code: 2697643 through August 15, 2019
About Universal Insurance Holdings, Inc.
Universal Insurance Holdings, Inc. (UVE) is a holding company offering property and casualty insurance and value-added insurance services. We develop, market, and write insurance products for consumers predominantly in the personal residential homeowners lines of business and perform substantially all other insurance-related services for our primary insurance entities, including risk management, claims management and distribution. We sell insurance products through both our appointed independent agents and through our direct online distribution channels in the United States across 18 states (primarily Florida). Learn more at UniversalInsuranceHoldings.com.
Non-GAAP Financial Measures
This press release contains non-GAAP financial measures within the meaning of Regulation G promulgated by the U.S. Securities and Exchange Commission (“SEC”), including adjusted earnings per diluted share for the second quarter of 2019 and 2018, in each case excluding the impact of the net realized and unrealized gains and losses on investments as well as extraordinary reinstatement premiums and associated commissions. Extraordinary reinstatement premiums are not covered by reinstatement premium protection and attach just below the Florida Hurricane Catastrophe Fund (FHCF) reinsurance layer. Adjusted operating income for the second quarter of 2019 and 2018, in each case, exclude the impact of the net realized and unrealized gains and losses on investments, as well as interest expense and extraordinary reinstatement premiums and associated commissions. A “non-GAAP financial measure” is generally defined as a numerical measure of a company’s historical or future performance that excludes or includes amounts, or is subject to adjustments, so as to be different from the most directly comparable measure calculated and presented in accordance with generally accepted accounting principles (“GAAP”). UVE management believes that these non-GAAP financial measures, when considered together with the GAAP financial measures, provide information that is useful to investors in understanding period-over-period operating results separate and apart from items that may, or could, have a disproportionately positive or negative impact on results in any particular period. UVE management also believes that these non-GAAP financial measures enhance the ability of investors to analyze UVE’s business trends and to understand UVE’s performance. UVE’s management utilizes these non-GAAP financial measures as guides in long-term planning. Non-GAAP financial measures should be considered in addition to, and not as a substitute for or superior to, financial measures presented in accordance with GAAP.
Forward-Looking Statements
This press release may contain “forward-looking statements” within the meaning of the Private Securities Litigation Reform Act of 1995. The words “believe,” “expect,” “anticipate,” “will,” “plan,” and similar expressions identify forward-looking statements, which speak only as of the date the statement was made. Such statements may include commentary on plans, products and lines of business, marketing arrangements, reinsurance programs and other business developments and assumptions relating to the foregoing. Forward-looking statements are inherently subject to risks and uncertainties, some of which cannot be predicted or quantified. Future results could differ materially from those described, and the Company disclaims any intention or obligation to update or revise any forward-looking statements, whether as a result of new information, future events, or otherwise. For further information regarding risk factors that could affect the Company’s operations and future results, refer to the Company’s reports filed with the Securities and Exchange Commission, including the Company’s Annual Report on Form 10-K.
Investor Relations Contact:
Rob Luther 954-958-1200 Ext. 6750
VP, Corporate Development, Strategy & IR
rluther@universalproperty.com
Media Relations Contact:
Andy Brimmer / Mahmoud Siddig 212-355-4449
Joele Frank, Wilkinson Brimmer Katcher
(2) Includes reinstatement premiums not covered by reinstatement premium protection and related commissions.